KRIs & KPIs
Stay ahead of risk with KRIs and KPIs that stay up to date
Centralize KRIs, KPIs, and GRC indicators in a single platform.
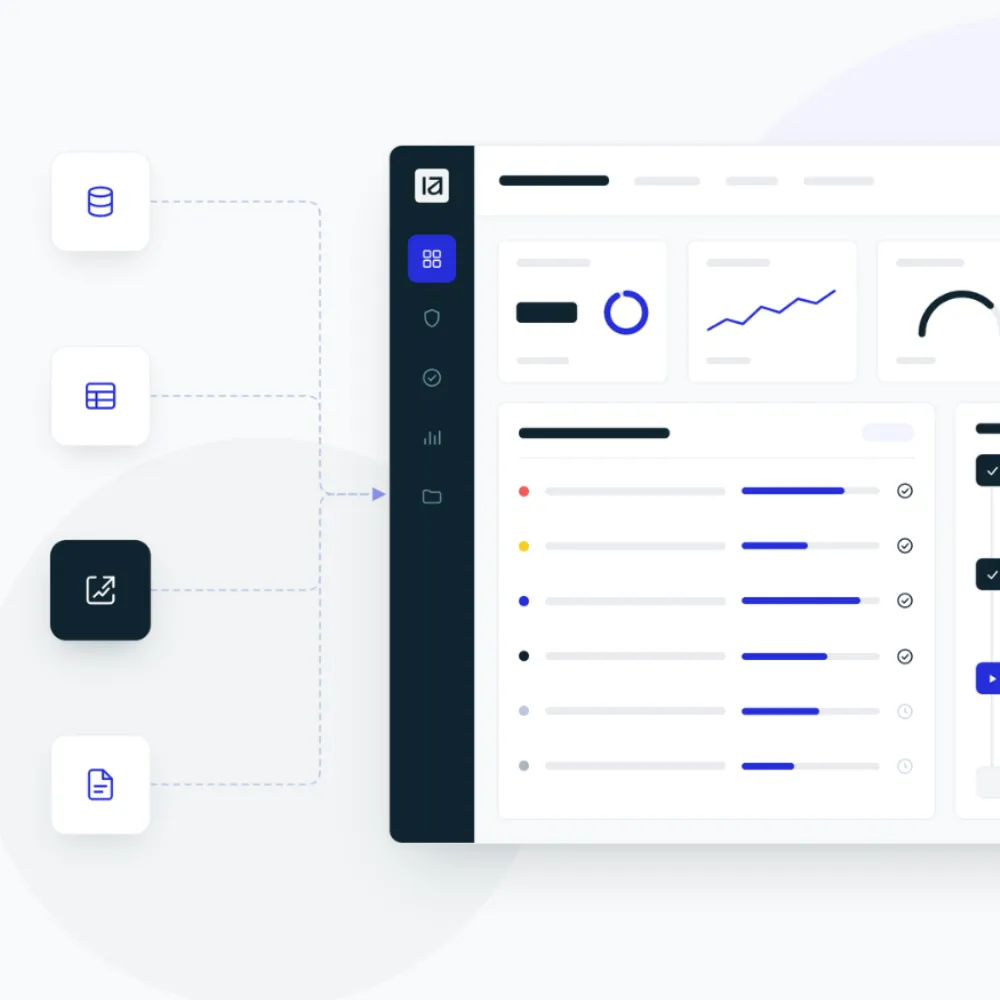
Automate data collection, track changes over time, and monitor risks, controls, and action plans through interactive dashboards.
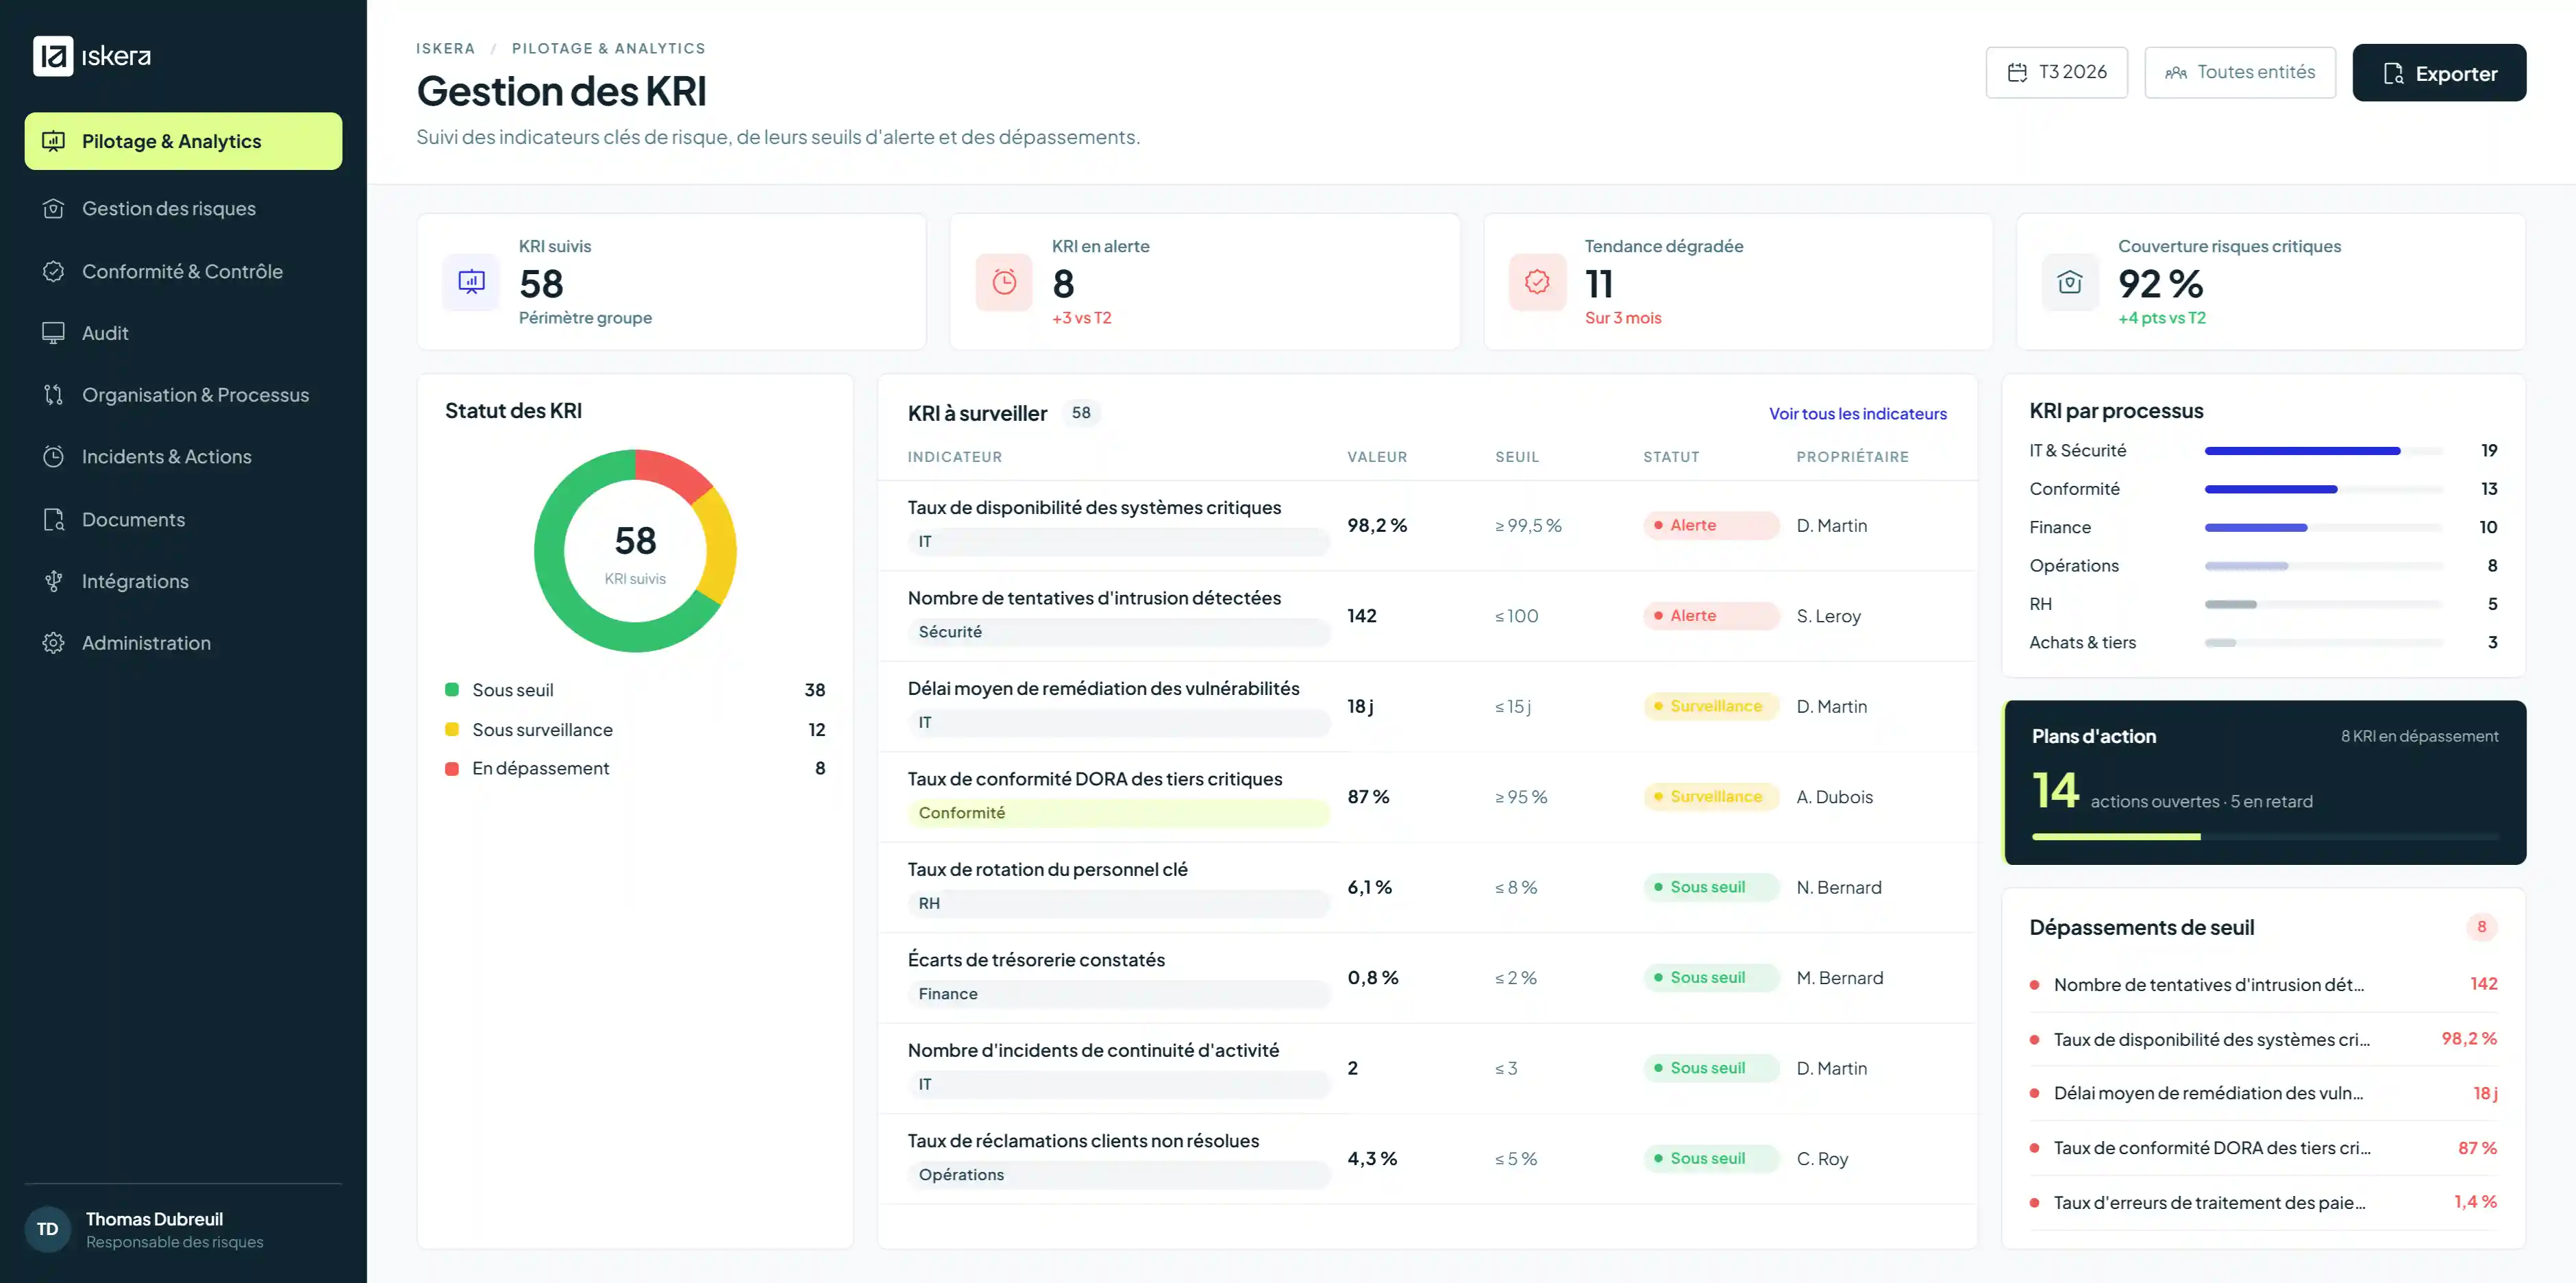
Turn indicators into early warning signals
Use your indicators to spot meaningful changes early, identify areas requiring attention, and guide decisions. Give teams a reliable, consolidated view of performance and risk across the organization.
Track the indicators that matter most
Create KRIs, KPIs, and governance indicators around your objectives.
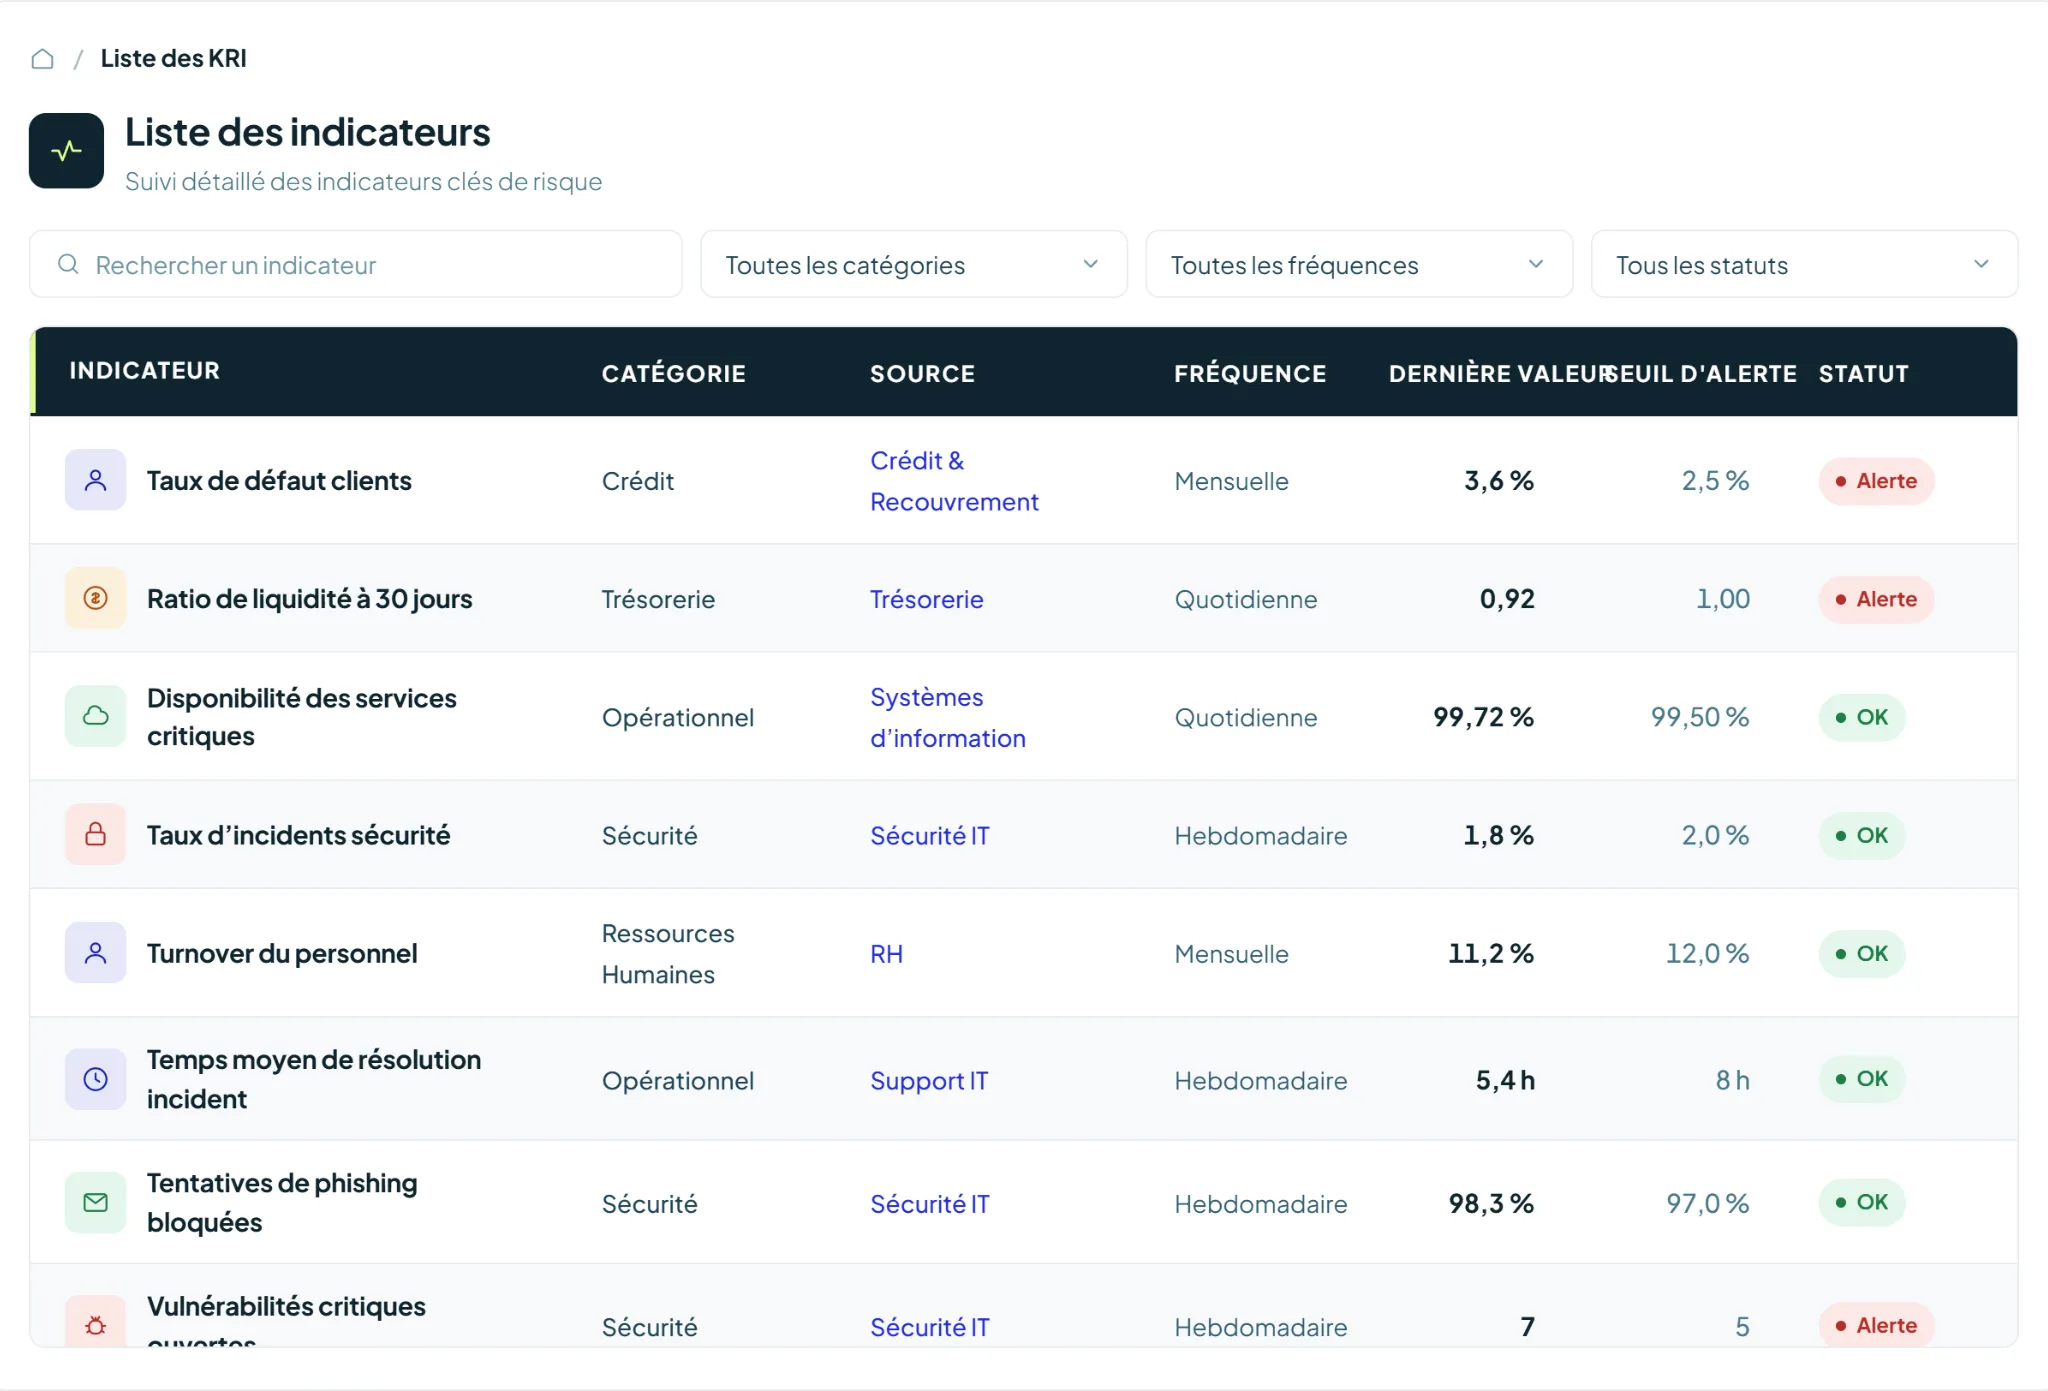
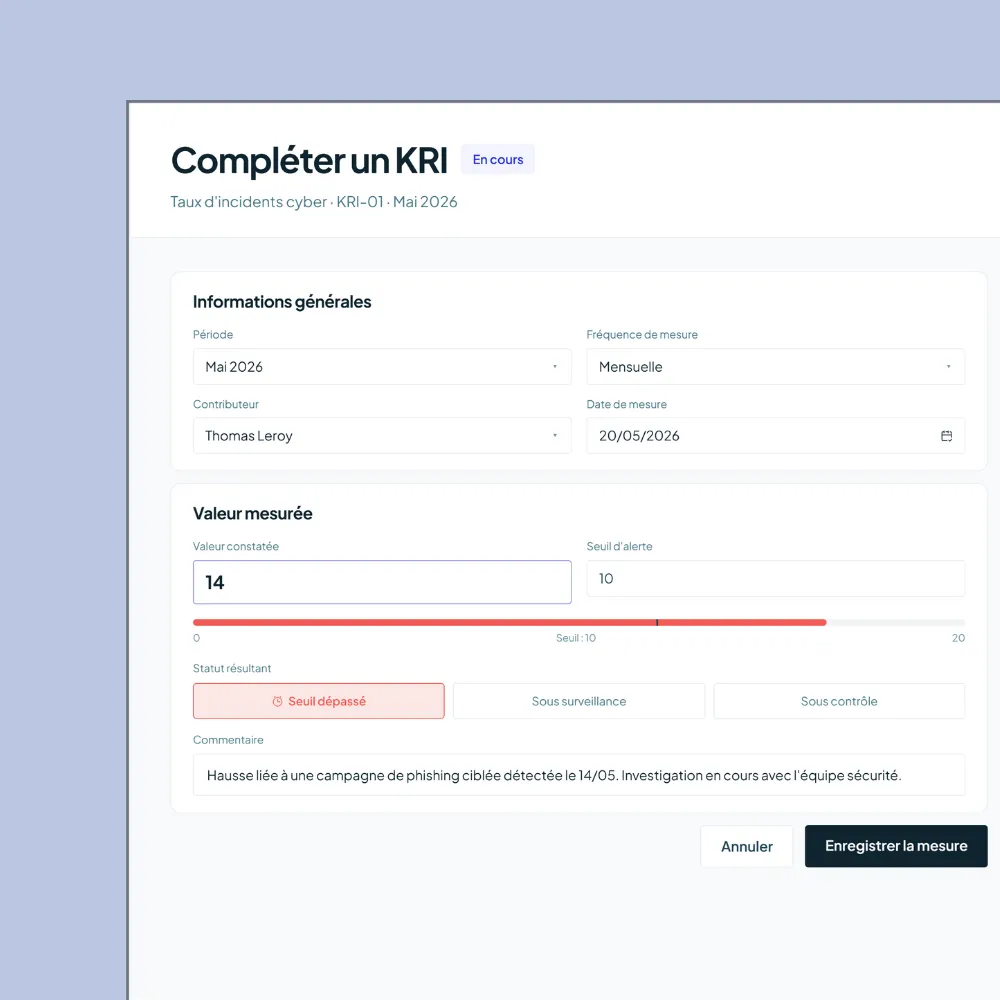
Define calculation methods, update frequencies, alert thresholds, and owners to build indicators that fit the way your organization works.
- Custom KRIs and KPIs
- Configurable calculation methods
- Alert thresholds
Stop chasing indicator updates
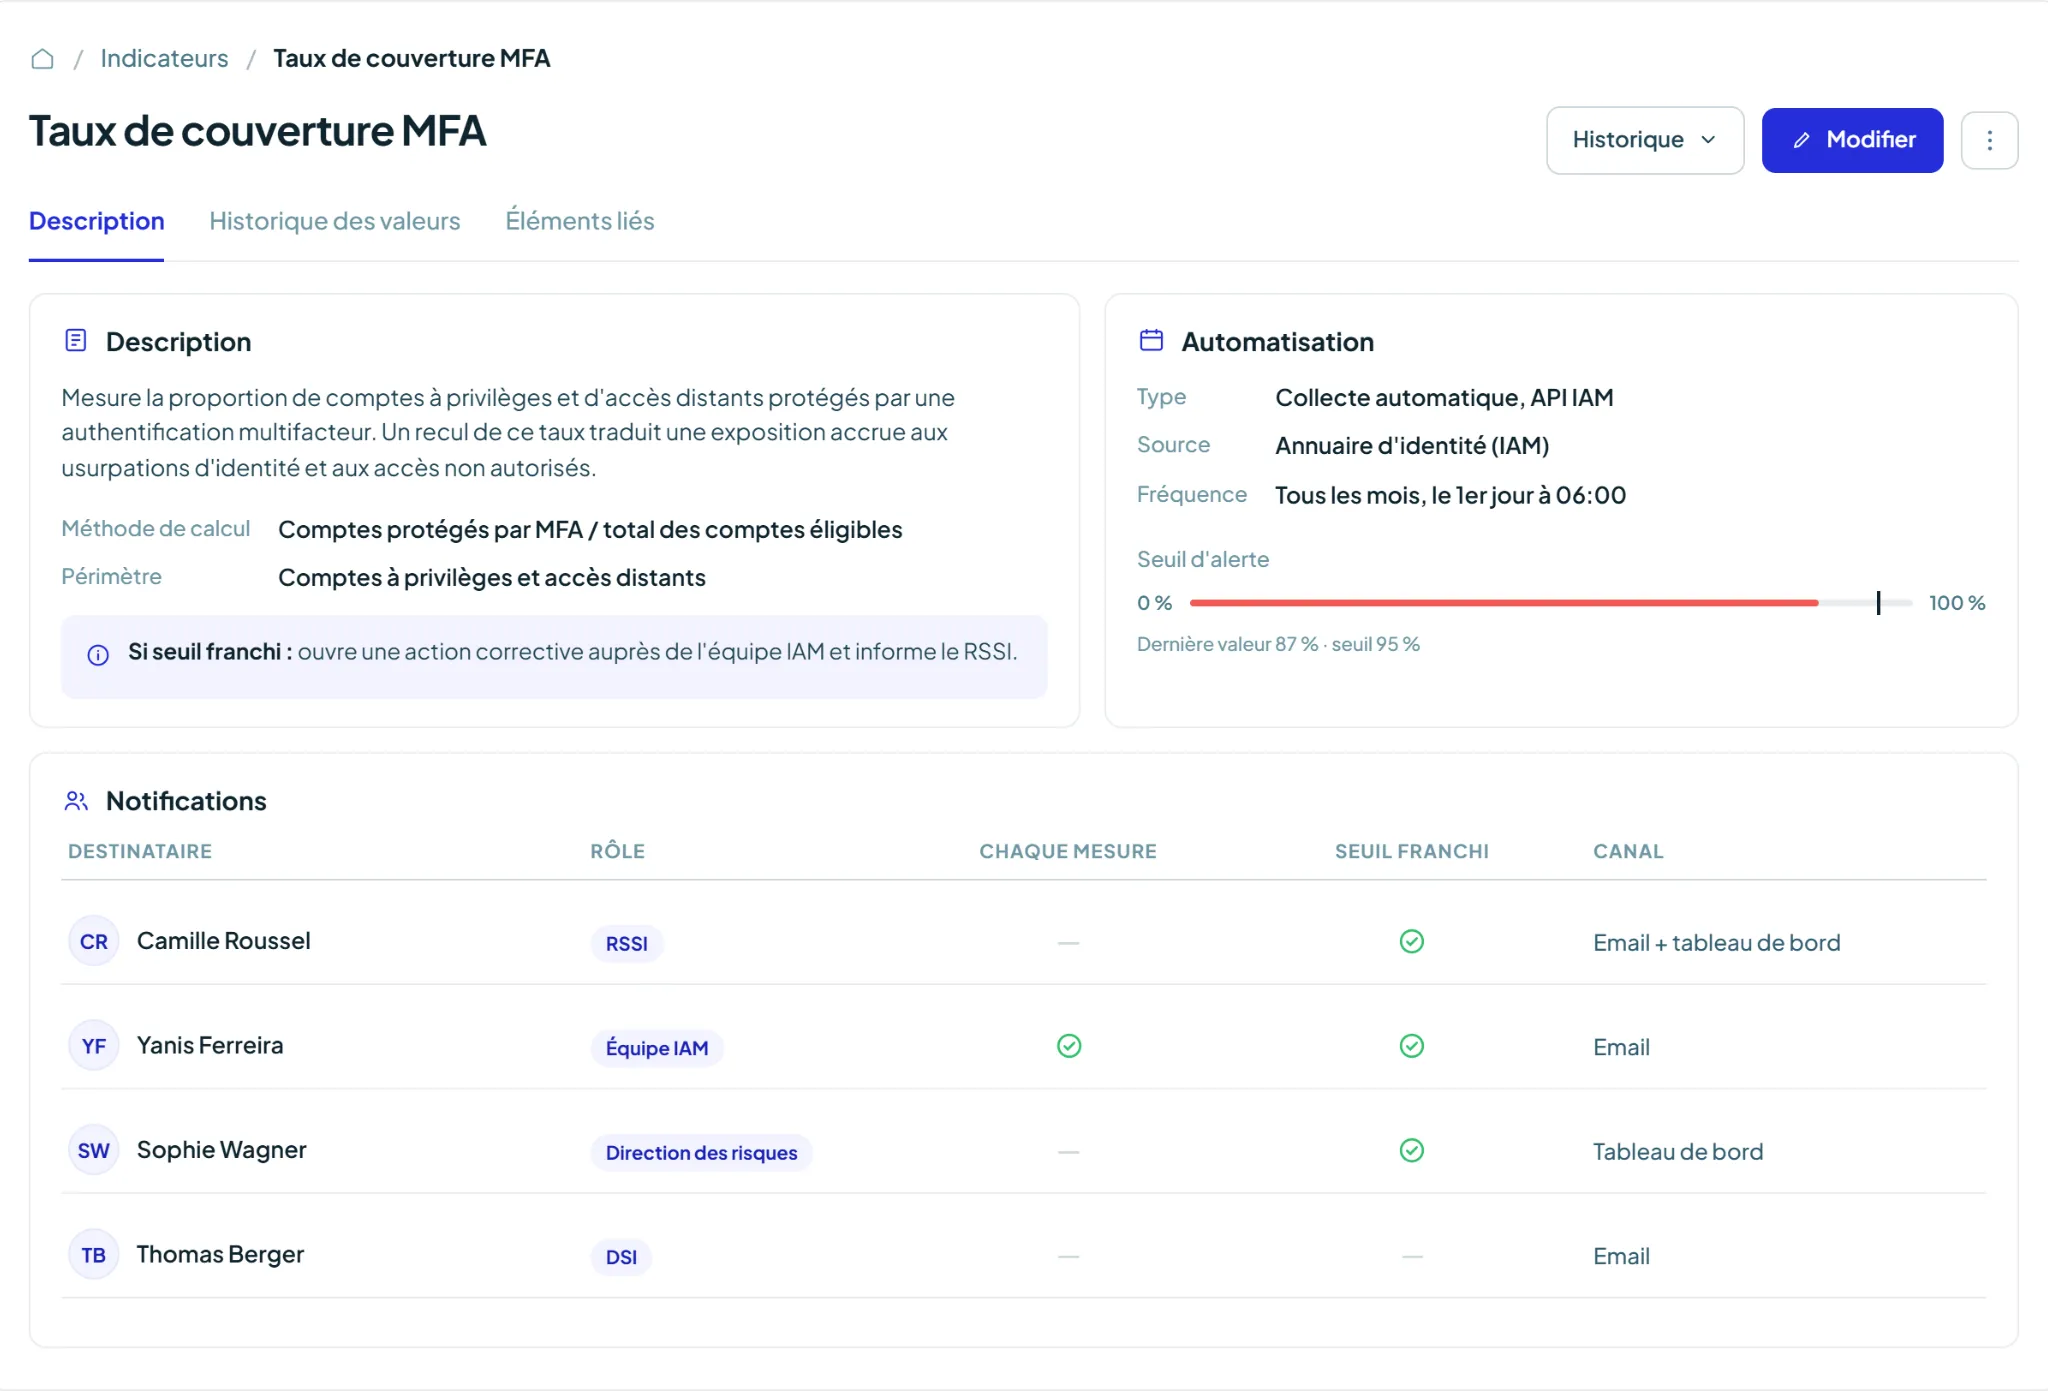
Schedule recurring data collection and automatically prompt the right contributors to submit their values.
Iskera handles notifications and reminders, centralizes submitted data, and tracks every deadline so your indicators stay reliable and up to date.
- Scheduled data collection
- Automated notifications and reminders
- Expected indicator tracking
Know when an indicator needs action
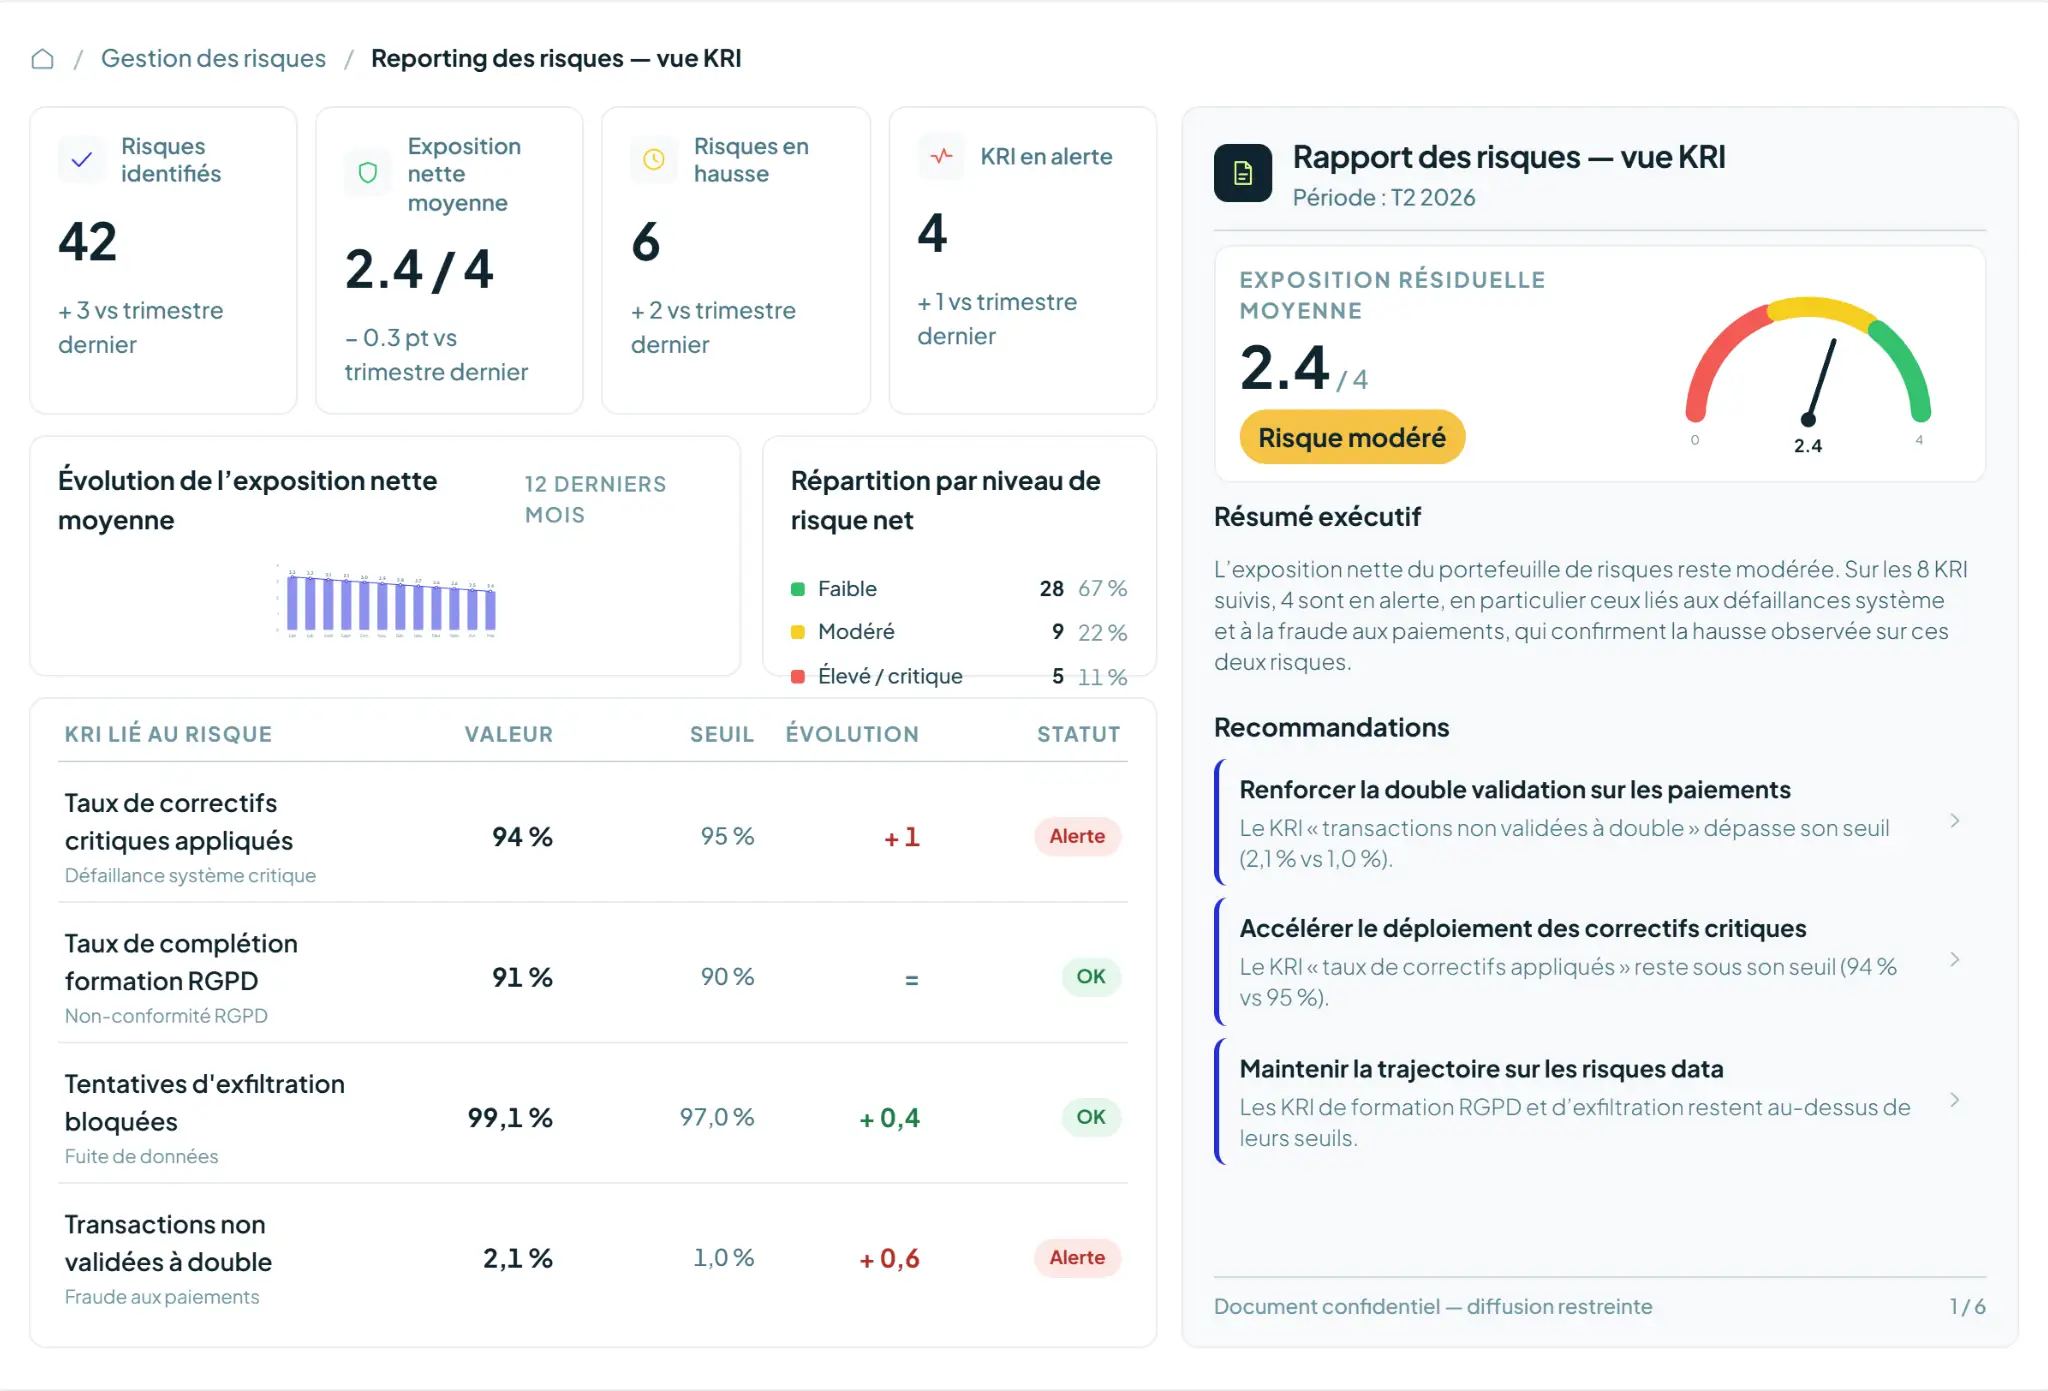
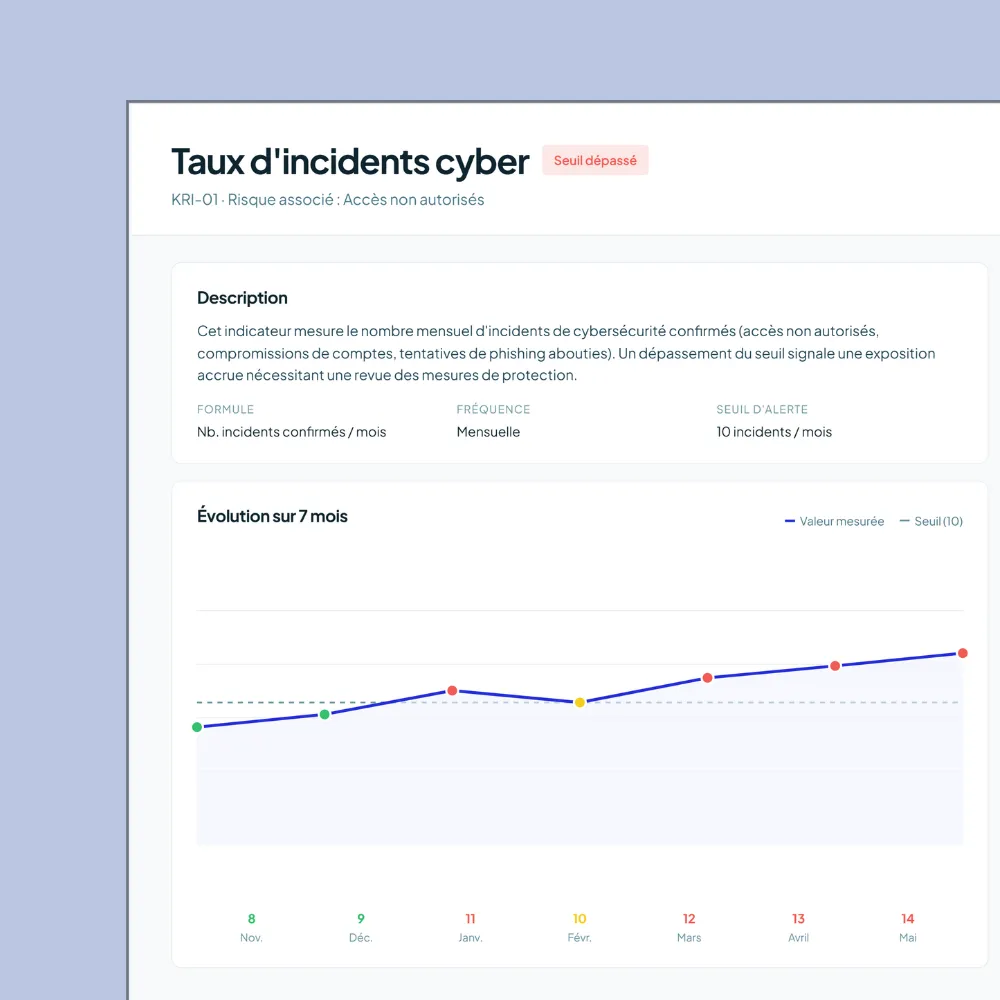
Track KRI and KPI trends, compare results against targets, and instantly identify indicators that cross alert thresholds.
Prioritize the right actions and focus attention where intervention is needed most.
- Custom alert thresholds
- Threshold breach detection
- Action prioritization
Turn indicators into better decisions
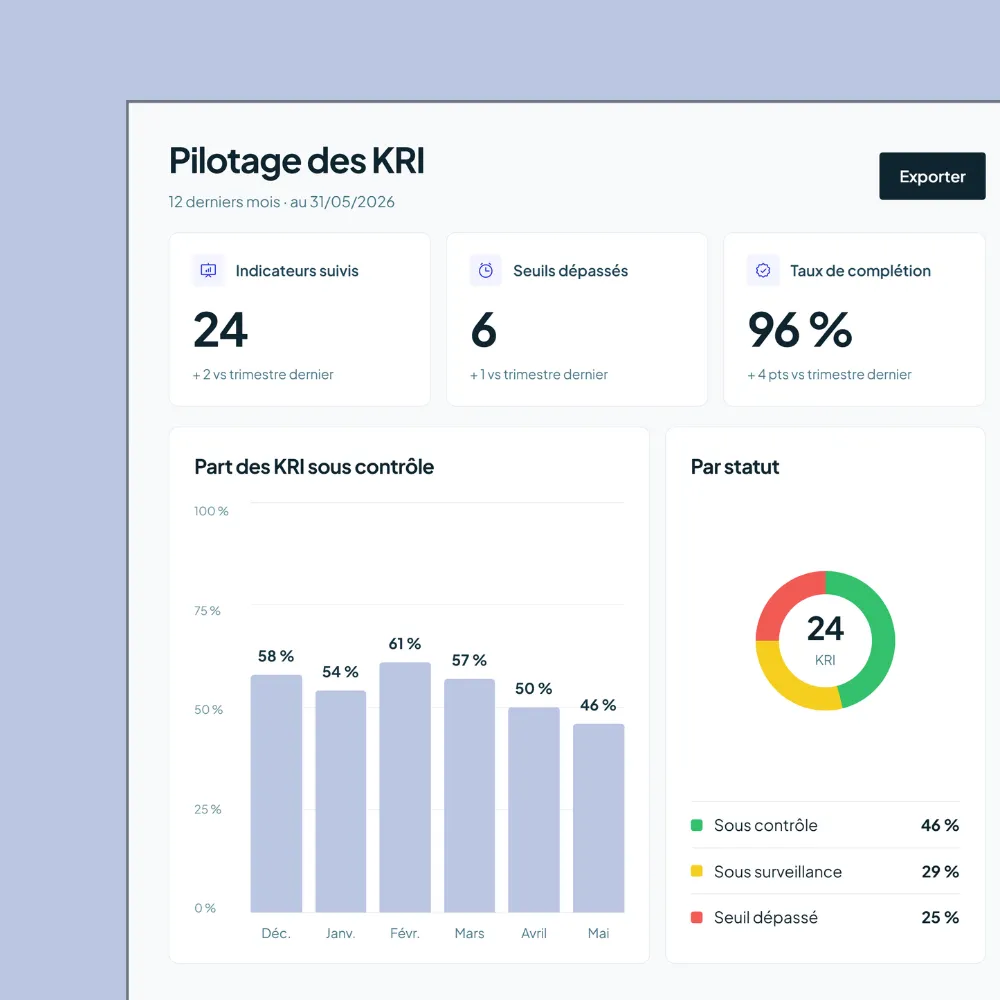
Bring your key indicators together to monitor performance, understand how your organization is evolving, and share reliable insights with decision-makers.
AI-assisted analysis helps surface trends and priorities faster.
- Consolidated view
- Shared reporting
- AI-assisted analysis
Move from measuring performance to driving action

100%
of your indicators centralized to manage performance and risk
- 01
React faster to what matters
Keep an up-to-date view of your key indicators to spot meaningful changes early and adjust priorities accordingly.
- 02
Make indicator ownership clear
Engage business owners through a structured process, clear responsibilities, and better visibility into results.
- 03
Build governance on reliable data
Use consistent, historical, and shared data to support governance reviews, management committees, and decisions across teams.
- 04
See the impact of every decision
Track indicators over time to measure the effectiveness of actions and adjust your strategy when needed.
Turn KRIs and KPIs into action in 3 steps
Structure your indicators, engage teams in keeping them current, and turn data into actionable insights for stronger governance.
01
Build the right KRI and KPI framework
Define the indicators that match your priorities, along with calculation methods, targets, and thresholds.
Assign clear ownership to create a shared framework for performance and risk monitoring.
02
Keep every indicator up to date
Organize data collection and involve contributors in regular updates.
Automate requests, notifications, and reminders to keep indicators reliable and current.
03
Turn insight into governance decisions
Analyze trends, identify gaps, and spot areas requiring attention.
Use indicators in dashboards and governance reviews to prioritize actions and support decision-making.
Everything you need to manage KRIs and KPIs with confidence
.webp)
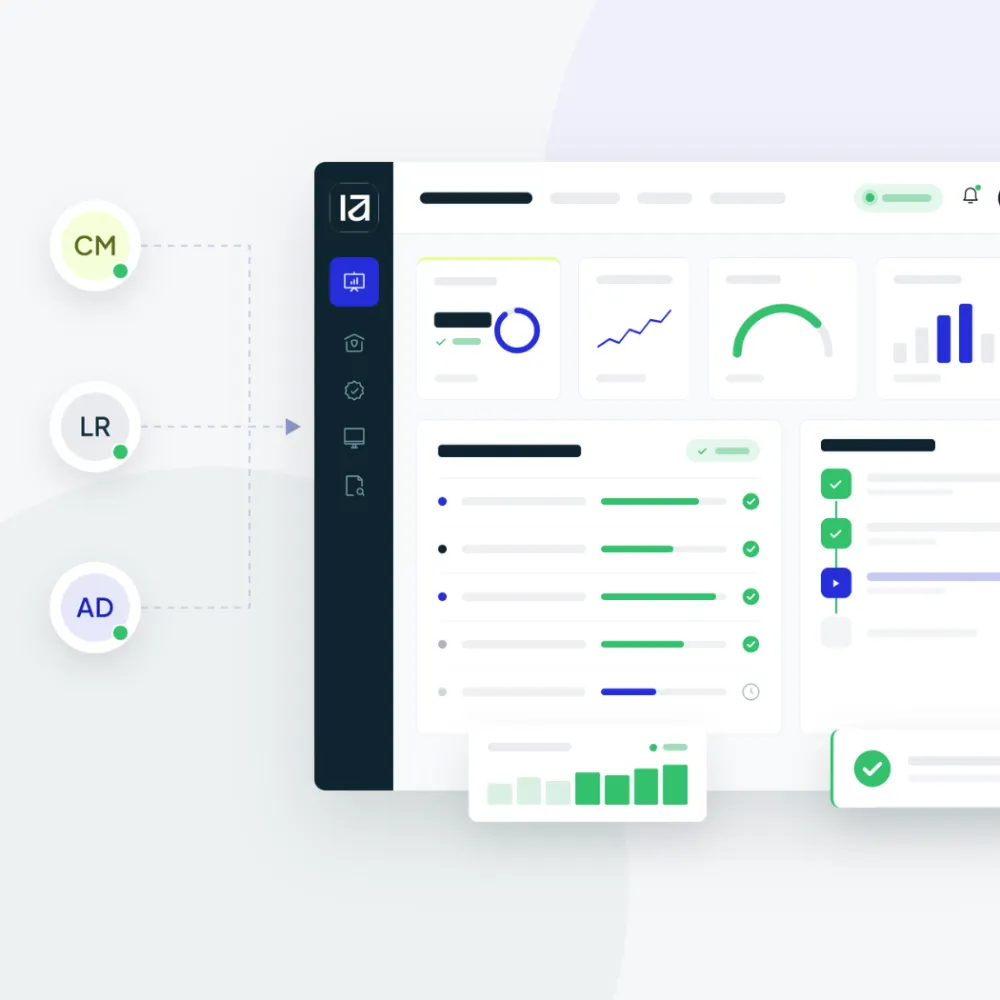
From scattered indicators to automated KRI and KPI management

OTHER SOLUTIONS
Connect your indicators to the rest of your GRC framework
KRIs and KPIs become more meaningful when connected to risks, controls, audits, incidents, and action plans.
Iskera brings this information together to produce reliable indicators and give teams a clearer view of performance and risk.
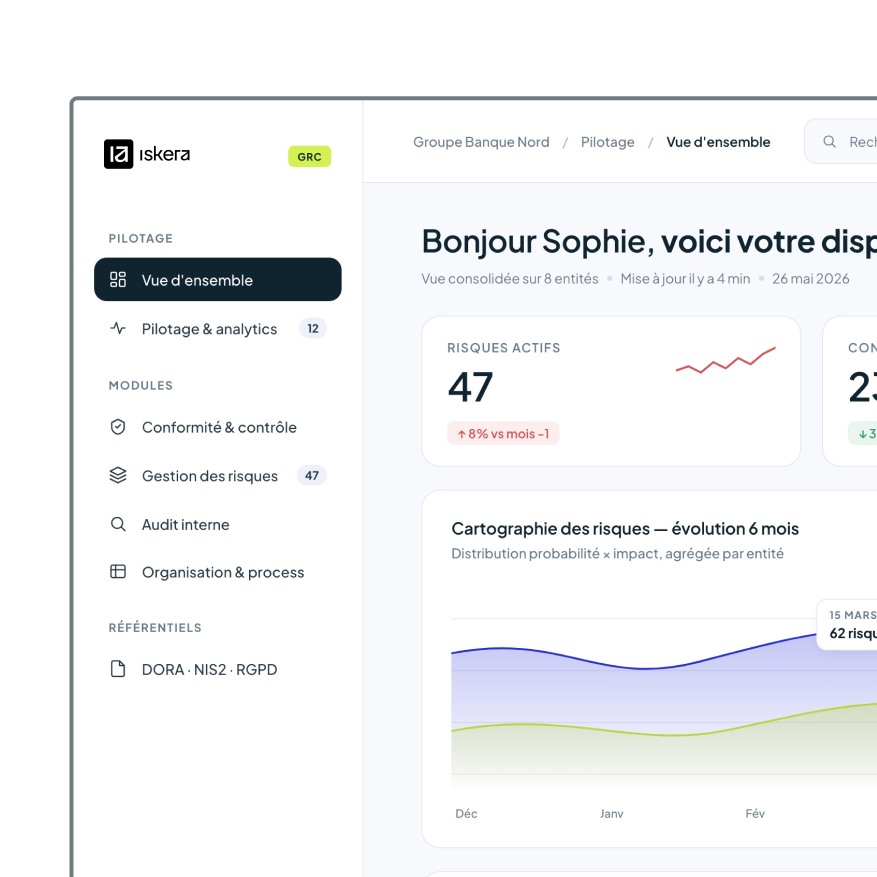
A demo that speaks your language, a clear vision as a result
See how Iskera helps you define KRIs and KPIs, automate data collection, track trends, and build reliable dashboards to manage performance and risk.

Latest resources
Frequently asked questions
A KRI (Key Risk Indicator) is a metric used to monitor how a risk evolves over time. It helps organizations detect early warning signals, anticipate adverse trends, and act before a risk has a significant impact on the business.
A KPI (Key Performance Indicator) measures the performance of an activity, process, or objective.
A KRI (Key Risk Indicator) tracks changes in risk exposure or signals that a risk event may occur. Used together, they provide a more complete view of organizational performance and risk.
KRIs and KPIs can be entered manually by contributors or updated automatically when data sources are available. Iskera schedules recurring data collection, sends notifications and reminders, and consolidates submitted information to keep indicators reliable and current.
Pricing depends on factors such as the number of users, modules deployed, functional scope, and your organization's requirements. Contact our team for a tailored demonstration and quote.