Dashboards & KPIs
Turn your KPIs into better decisions
Define the KPIs that matter, automate data collection across your teams, and monitor performance through interactive dashboards.
Iskera brings your data together in one place so you can track objectives, spot gaps, and make faster, better-informed decisions.
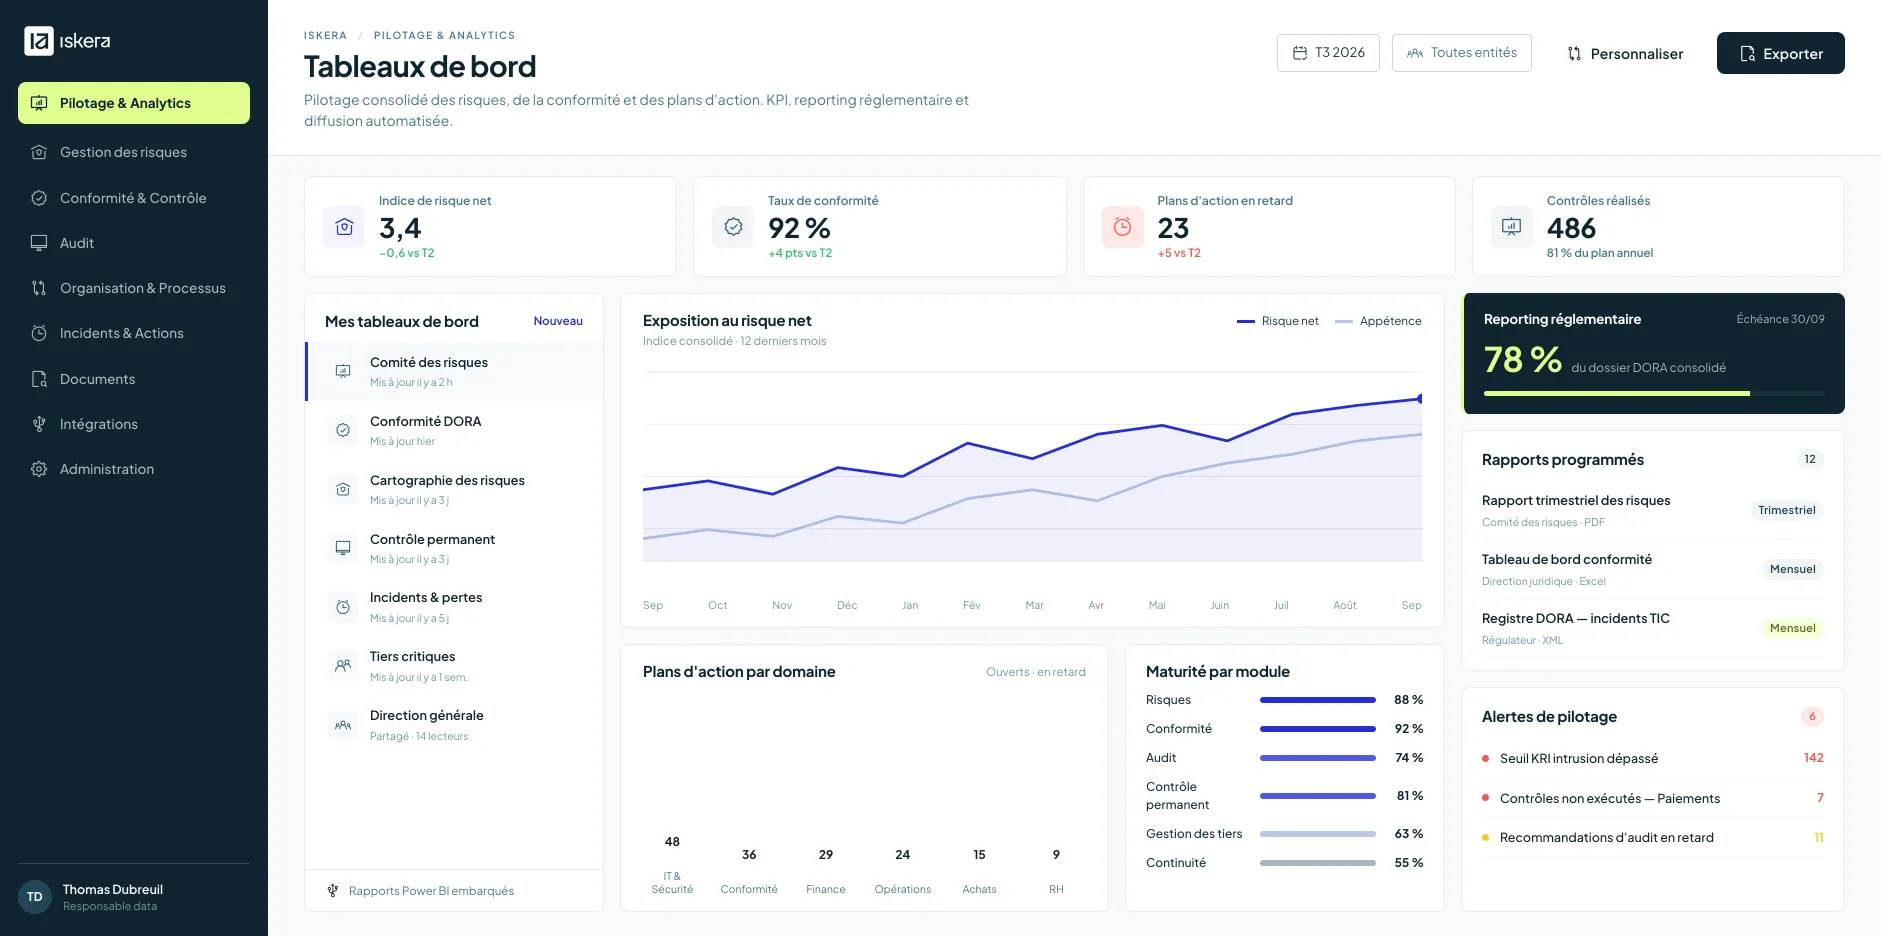
Reliable KPIs. Clearer decisions.
Track progress against your objectives, identify gaps, and focus your teams on what matters most with reliable, up-to-date performance data.
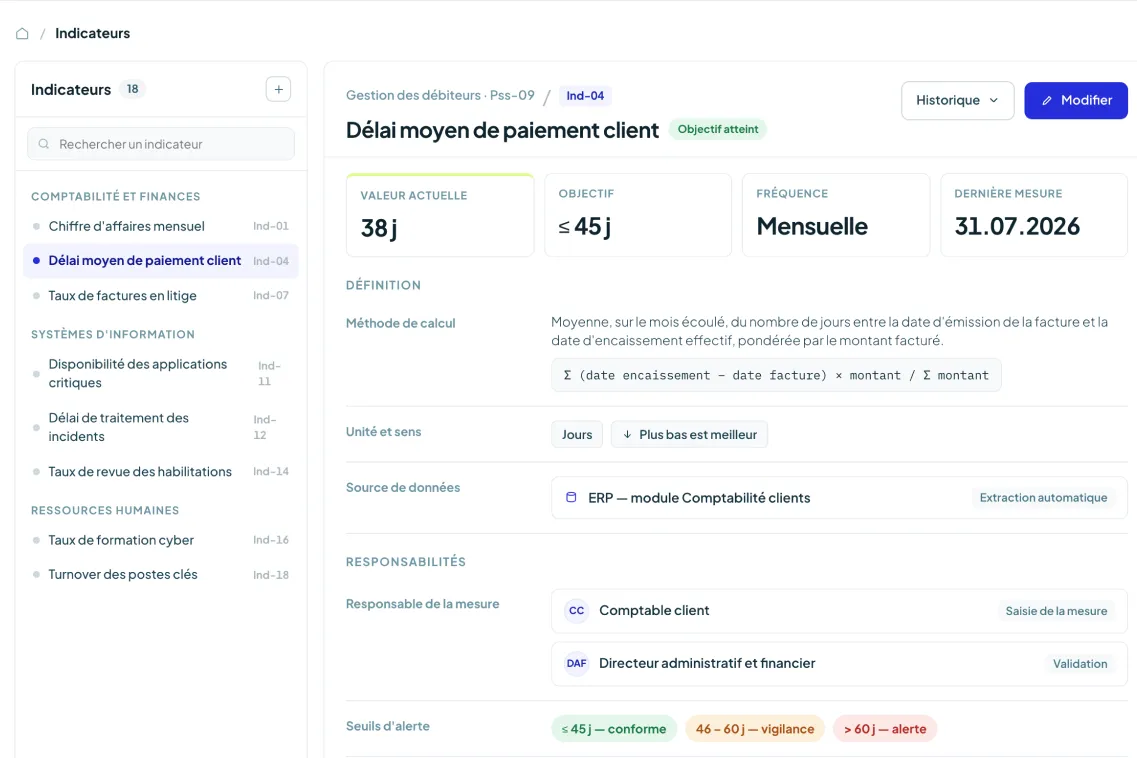
Build KPIs around what matters
Define the indicators you want to track, their targets, measurement frequency, owners, and calculation methods to create a consistent performance framework across your organization.
- Central KPI library
- Custom targets and thresholds
- Clear ownership and measurement frequency
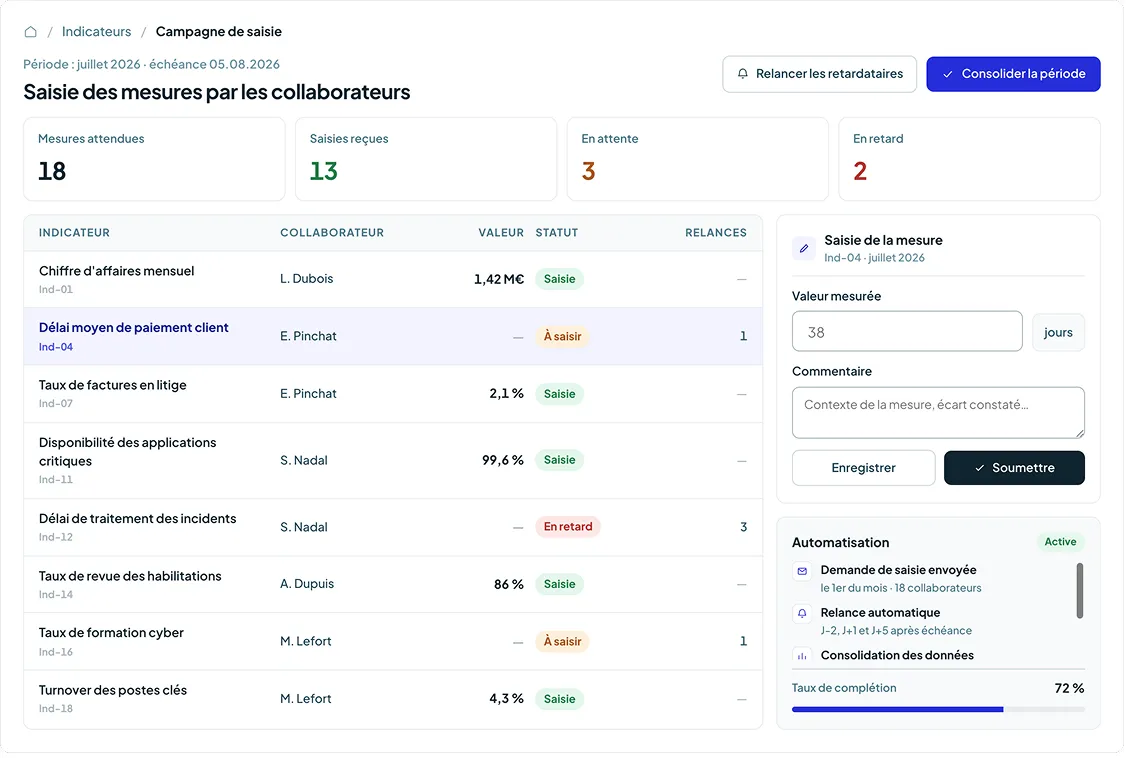
Automate KPI data collection
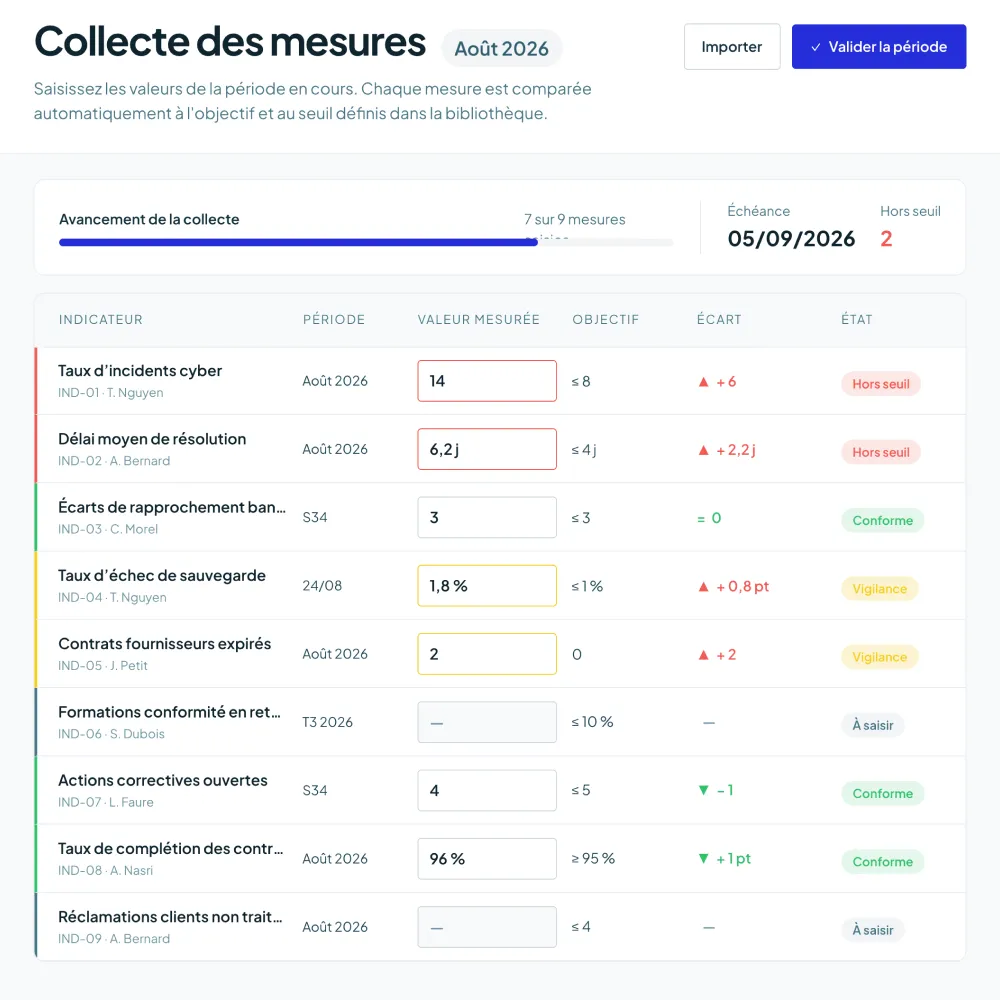
Teams enter the measures assigned to them directly in Iskera.
Automated requests and reminders keep data collection on schedule, while Iskera consolidates every measure in one place.
- Structured data collection
- Automated reminders
- Centralized KPI data
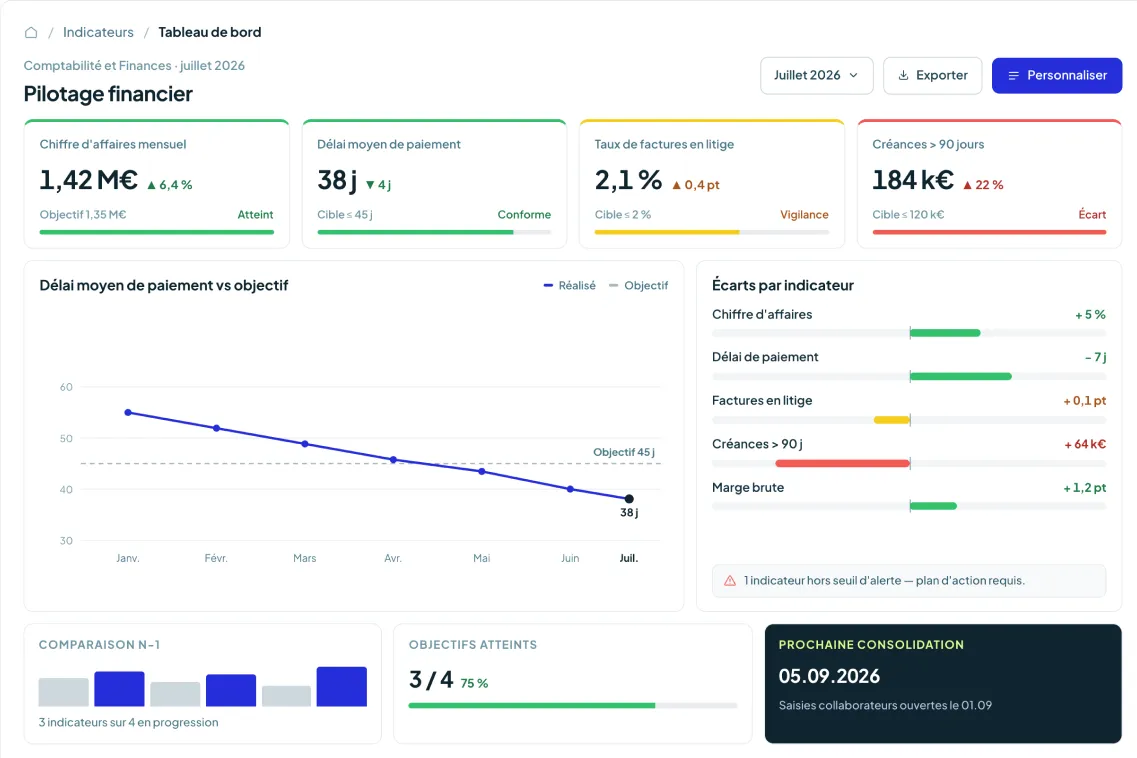
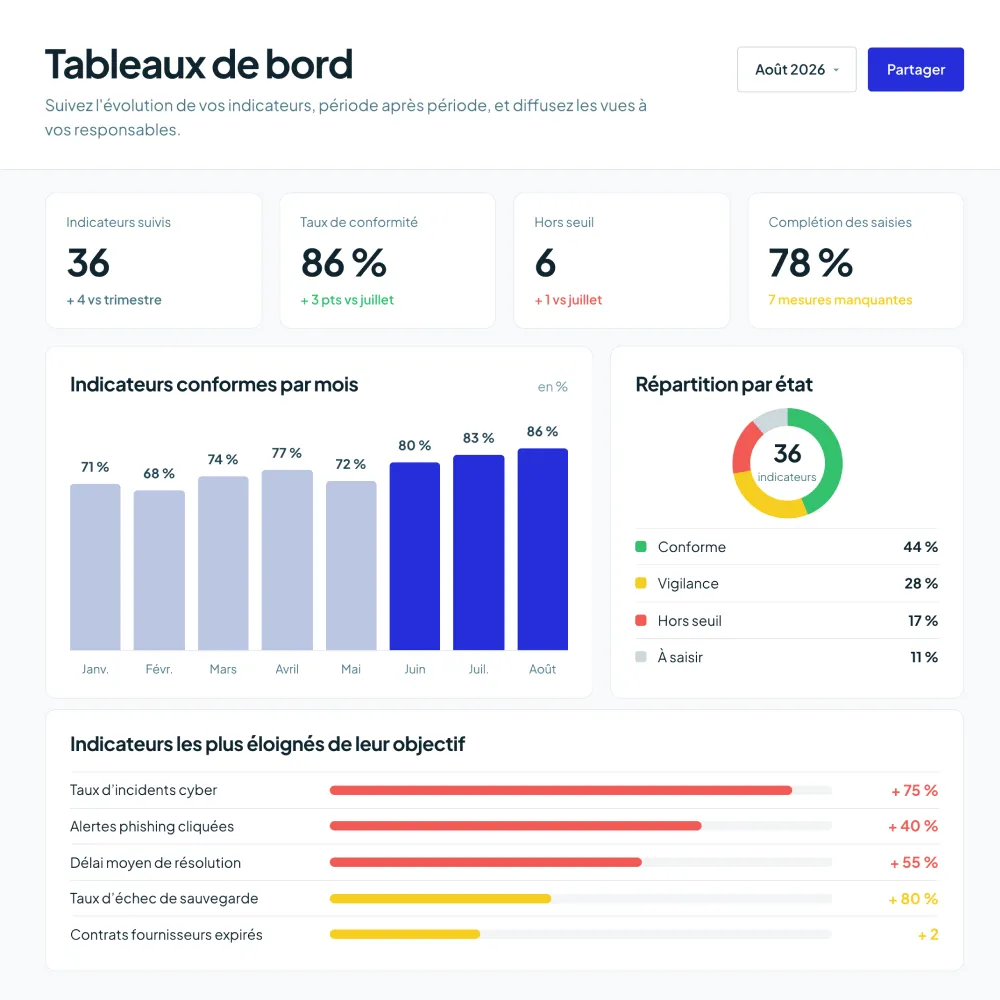
See performance at a glance
Turn your KPIs into tailored dashboards to monitor objectives, compare results, and quickly identify gaps.
- Custom dashboards
- Interactive charts
- Advanced filters
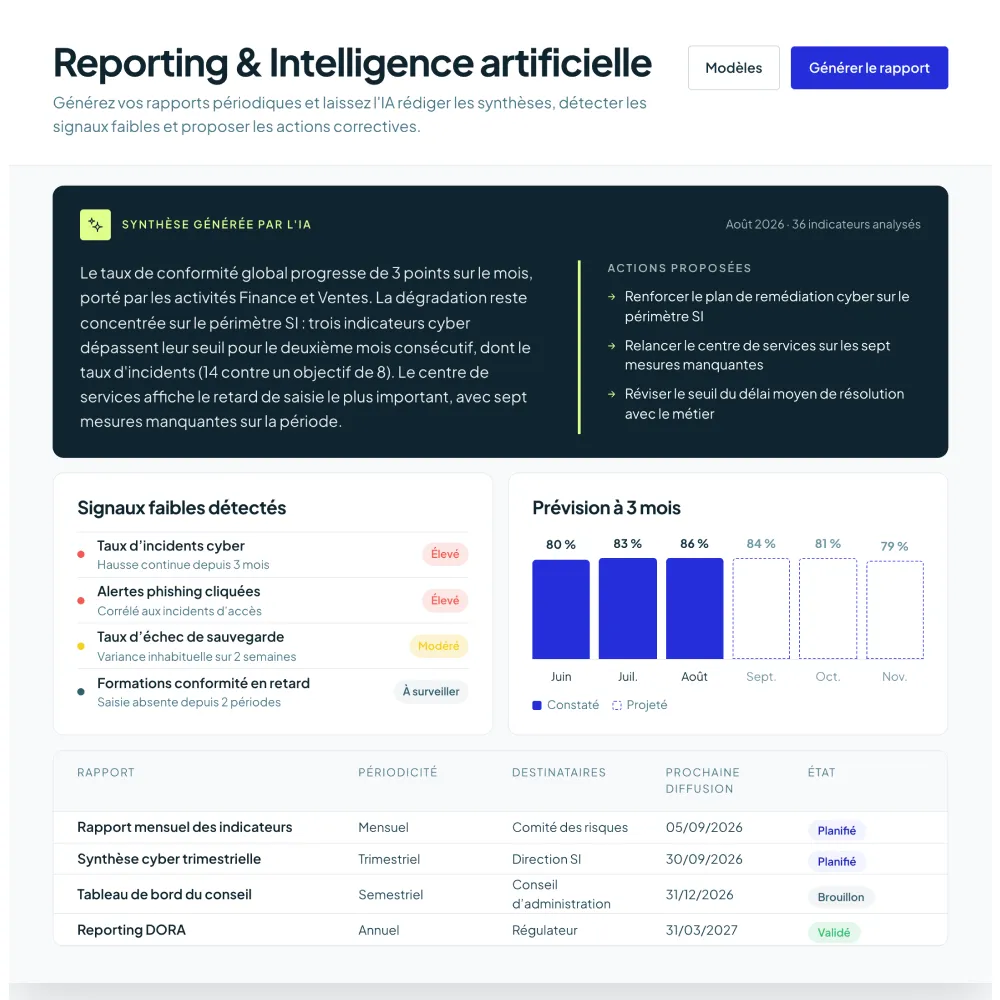
Share insights, not spreadsheets
Automatically share dashboards with executives, managers, and relevant teams. Keep everyone aligned with up-to-date reporting and a shared view of performance.
- Automated reporting
- Dashboard sharing
- AI-assisted analysis
Move from tracking metrics to driving performance

100%
of your KPIs centralized in a single platform
- 01
Stop chasing KPI updates
Automate data requests and reminders so teams can submit their measures on time without manual follow-up.
- 02
Work with data you can trust
Keep every measure centralized, traceable, and ready to use in your dashboards and analysis.
- 03
See what matters in real time
Monitor performance through dashboards tailored to each team, function, and level of management.
- 04
Turn insight into action
Use reliable KPIs to identify trends, anticipate gaps, and give teams a shared view for faster decision-making.
Go from KPI setup to actionable insights in 3 steps
From defining your indicators to analyzing results, build a reliable performance framework that keeps everyone aligned.
01
Define the KPIs that matter
Configure KPIs, targets, thresholds, owners, measurement frequency, and calculation methods.
02
Put ownership in the right hands
Assign KPIs to the right contributors and organize recurring data collection through a clear, shared process.
03
Turn results into decisions
Identify gaps, monitor trends, and share results with teams and governance bodies.
Everything you need to turn KPIs into action
.webp)
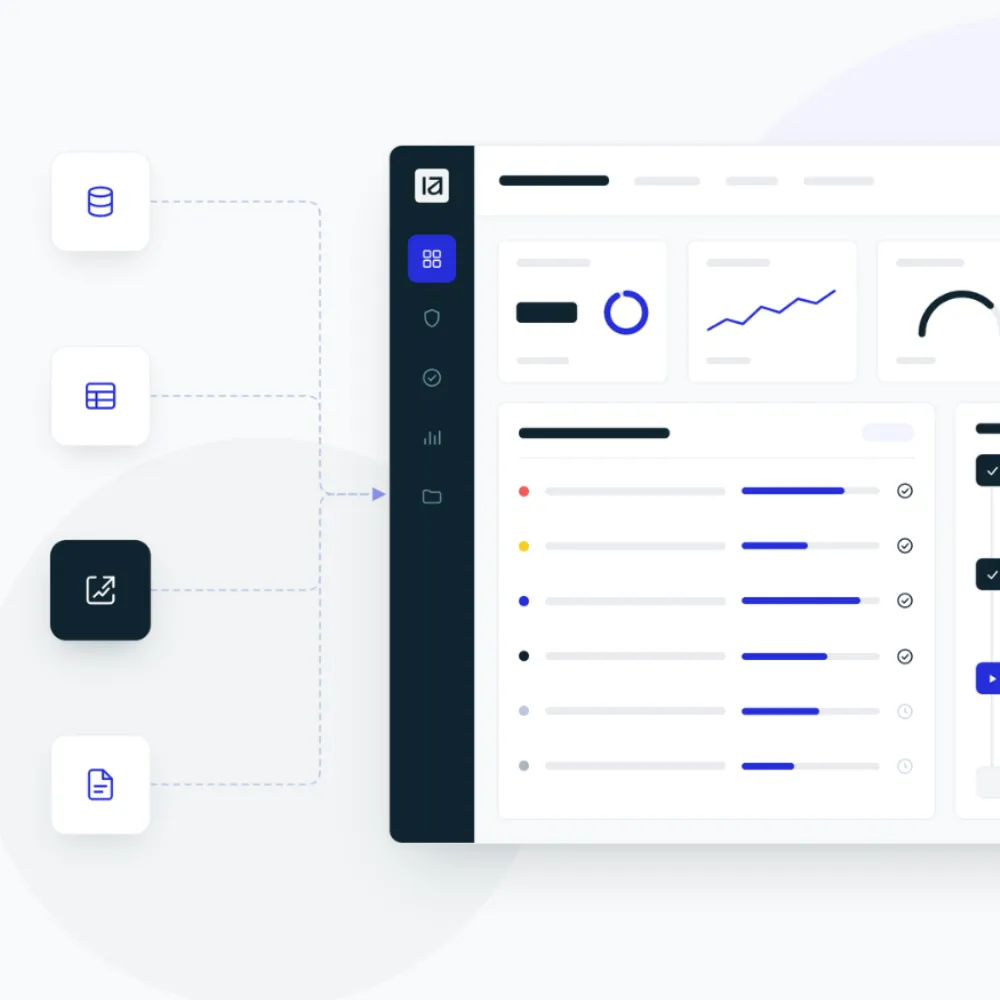
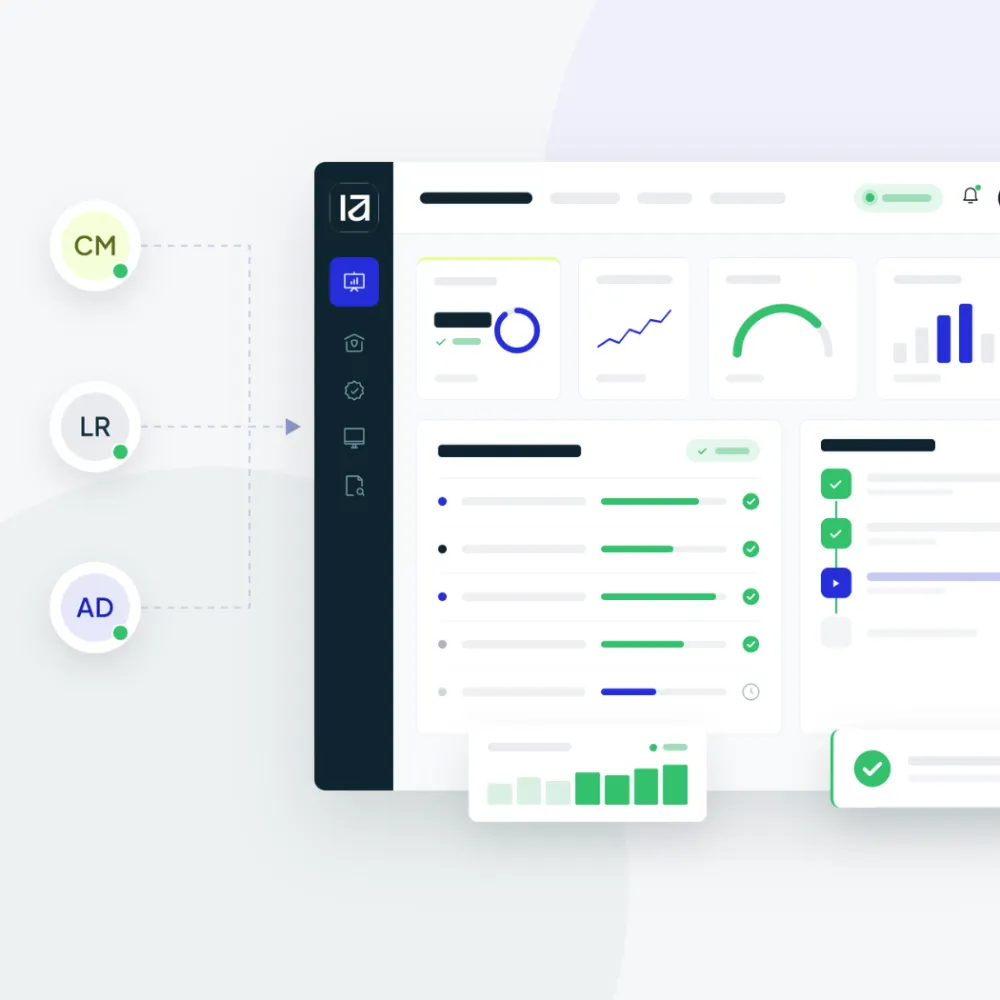
From scattered KPI tracking to automated performance management

OTHER SOLUTIONS
Connect your KPIs to the rest of your organization
KPIs become far more valuable when they are fed directly by the rest of your Iskera environment.
Connect risks, audits, controls, incidents, processes, and action plans to maintain a consistent, always up-to-date view of performance.
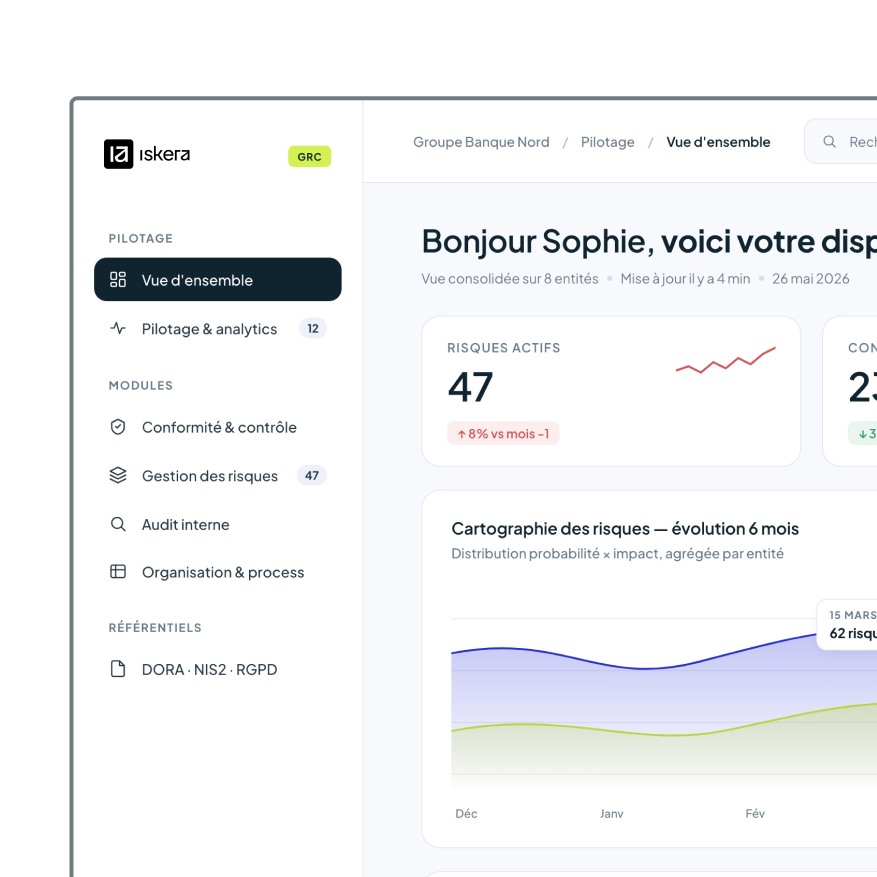
A demo that speaks your language, a clear vision as a result
See how Iskera helps you define the right KPIs, automate data collection, and turn performance data into clear, actionable dashboards and reports.

Latest resources
Frequently asked questions
KPI dashboard software helps organizations define key performance indicators, collect measures from contributors, centralize data, and visualize results through interactive dashboards to monitor performance and support decision-making.
Each KPI can be assigned to one or more contributors. Iskera automates data requests, reminders, and consolidation so teams always work with reliable, up-to-date information.
Yes. Users can create their own dashboards, choose which KPIs to display, configure widgets, and apply filters to match their role and reporting needs.
Yes. Dashboards can use data from risks, audits, controls, incidents, action plans, processes, and other connected data sources.